2. Collocation coefficient (C)
2.1. Description
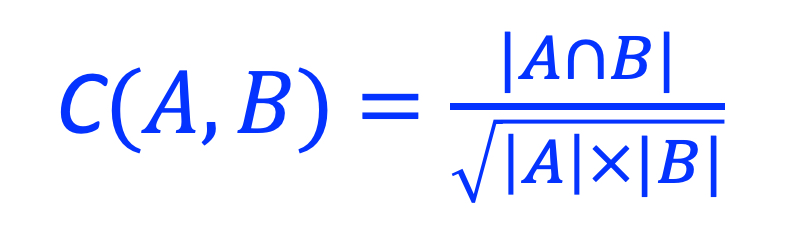
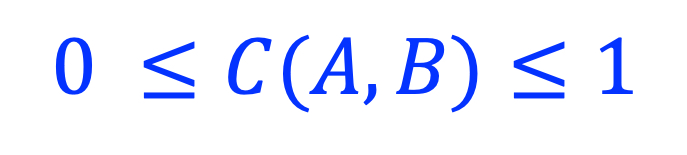
Calculate the collocation coefficient between two sets of genomic regions.
2.2. Usage
cobind.py overlap -h
usage: cobind.py overlap [-h] [--nameA NAMEA] [--nameB NAMEB] [-n ITER]
                         [-f SUBSAMPLE] [-b BGSIZE] [-o] [-l log_file] [-d]
                         input_A.bed input_B.bed

positional arguments:
  input_A.bed           Genomic regions in BED, BED-like or bigBed format. The
                        BED-like format includes:'bed3', 'bed4', 'bed6',
                        'bed12', 'bedgraph', 'narrowpeak', 'broadpeak',
                        'gappedpeak'. BED and BED-like format can be plain
                        text, compressed (.gz, .z, .bz, .bz2, .bzip2) or
                        remote (http://, https://, ftp://) files. Do not
                        compress BigBed foramt. BigBed file can also be a
                        remote file.
  input_B.bed           Genomic regions in BED, BED-like or bigBed format. The
                        BED-like format includes:'bed3', 'bed4', 'bed6',
                        'bed12', 'bedgraph', 'narrowpeak', 'broadpeak',
                        'gappedpeak'. BED and BED-like format can be plain
                        text, compressed (.gz, .z, .bz, .bz2, .bzip2) or
                        remote (http://, https://, ftp://) files. Do not
                        compress BigBed foramt. BigBed file can also be a
                        remote file.

options:
  -h, --help            show this help message and exit
  --nameA NAMEA         Name to represent 1st set of genomic interval. If not
                        specified (None), the file name ("input_A.bed") will
                        be used.
  --nameB NAMEB         Name to represent the 2nd set of genomic interval. If
                        not specified (None), the file name ("input_B.bed")
                        will be used.
  -n ITER, --ndraws ITER
                        Times of resampling to estimate confidence intervals.
                        Set to '0' to turn off resampling. For the resampling
                        process to work properly, overlapped intervals in each
                        bed file must be merged. (default: 20)
  -f SUBSAMPLE, --fraction SUBSAMPLE
                        Resampling fraction. (default: 0.75)
  -b BGSIZE, --background BGSIZE
                        The size of the cis-regulatory genomic regions. This
                        is about 1.4Gb For the human genome. (default:
                        1400000000)
  -o, --save            If set, will save peak-wise coefficients to files
                        ("input_A_peakwise_scores.tsv" and
                        "input_B_peakwise_scores.tsv").
  -l log_file, --log log_file
                        This file is used to save the log information. By
                        default, if no file is specified (None), the log
                        information will be printed to the screen.
  -d, --debug           Print detailed information for debugging.
2.3. Example
Calculate the overall collocation coefficient and peak-wise collocation coefficients between CTCF binding sites and RAD21 binding sites.
python3 ../bin/cobind.py overlap CTCF_ENCFF660GHM.bed RAD21_ENCFF057JFH.bed --save
The overall collocation coefficient between CTCF_ENCFF660GHM.bed and RAD21_ENCFF057JFH.bed was printed to screen
2022-02-24 08:06:29 [INFO]  Calculate collocation coefficient (overall) ...
A.name               CTCF_ENCFF660GHM.bed
B.name              RAD21_ENCFF057JFH.bed
A.interval_count                    58684
B.interval_count                    33373
A.size                           12184840
B.size                           11130268
A_or_B.size                      18375623
A_and_B.size                      4939485
Coef                               0.4241
Coef(expected)                     0.0083
Coef(95% CI)              [0.4223,0.4275]
dtype: object
2023-07-04 08:08:18 [INFO]  Calculate collocation coefficient (peak-wise) ...
2023-07-04 08:08:18 [INFO]  Read and union BED file: "CTCF_ENCFF660GHM.bed"
2023-07-04 08:08:18 [INFO]  Unioned regions of "CTCF_ENCFF660GHM.bed" : 58584
2023-07-04 08:08:18 [INFO]  Read and union BED file: "RAD21_ENCFF057JFH.bed"
2023-07-04 08:08:19 [INFO]  Unioned regions of "RAD21_ENCFF057JFH.bed" : 31955
2023-07-04 08:08:19 [INFO]  Build interval tree for unioned BED file: "CTCF_ENCFF660GHM.bed"
2023-07-04 08:08:19 [INFO]  Build interval tree for unioned BED file: "RAD21_ENCFF057JFH.bed"
2023-07-04 08:08:19 [INFO]  Calculate the overlap coefficient of each genomic region in CTCF_ENCFF660GHM.bed ...
2023-07-04 08:08:21 [INFO]  Save peakwise scores to CTCF_ENCFF660GHM.bed_peakwise_scores.tsv ...
2023-07-04 08:08:21 [INFO]  Calculate the overlap coefficient of each genomic region in RAD21_ENCFF057JFH.bed ...
2023-07-04 08:08:22 [INFO]  Save peakwise scores to RAD21_ENCFF057JFH.bed_peakwise_scores.tsv ...
If --save was specified, the peakwise collocation coefficients were saved to CTCF_ENCFF660GHM.bed_peakwise_scores.tsv and RAD21_ENCFF057JFH.bed_peakwise_scores.tsv, respectively.
$ head -5 CTCF_ENCFF660GHM.bed_peakwise_scores.tsv

chrom start end A.size  B.size  A∩B A∪B B.list  Score
chr12 108043  108283  240 404 240 404 chr12:107919-108323 0.770752493308062
chr12 153232  153470  238 222 222 238 chr12:153236-153458 0.965801796044974
chr12 177749  177989  240 NA  NA  NA  NA  NA
chr12 189165  189405  240 404 240 404 chr12:189072-189476 0.770752493308062
- column 1 to 3
The genomic coordinate of CTCF peak.
- column 4 (A.size)
The size of CTCF peak.
- column 5 (B.size)
The size (cardinality) of RAD21 peak(s) that were overlapped with this CTCF peak.
- column 6 (A∩B)
The size (cardinality) of intersection.
- column 7 (A∪B)
The size (cardinality) of union.
- column 8 (B.list)
List of RAD21 peak(s) that are overlapped with this peak. Multiple peaks will be separated by “,”.
- column 9 (Score)
The peakwise collocation coefficient.