Compare different metrics
The table below gives the lower and upper bounds of the 6 metrics and their major drawbacks if any.
Metric |
Lower bound |
Upper bound |
Comments |
|---|---|---|---|
C(A,B) |
0 (no overlap) |
1 (A = B) |
|
J(A,B) |
0 (no overlap) |
1 (A = B) |
Bias towards the larger interval |
SD(A,B) |
0 (no overlap) |
1 (A = B) |
Bias towards the larger interval |
SS(A,B) |
0 (no overlap) |
1 (A = B, A ∈ B, or B ∈ A) |
Bias towards the smaller interval |
PMI |
-inf (no overlap) |
min(-log(p(A)), -log(p(B))) |
No fixed bound |
NPMI |
-1 (no overlap) |
1 (A = B) |
The table below compares the intersection-based metrics. C, J, SD, and SS. All the four metrics are bounded by 0 and 1. When the size of the two genomic intervals are significanlty different, C is less sensitive to the extreme, and gives a compromised score compared to J/SD and SS.
SROG |
|A| |
|B| |
|A ∩ B| |
|A ∪ B| |
C |
J |
SD |
SS |
|---|---|---|---|---|---|---|---|---|
A equals B |
1000 |
1000 |
1000 |
1000 |
1 |
1 |
1 |
1 |
A disjoint B |
1000 |
1000 |
0 |
2000 |
0 |
0 |
0 |
0 |
A overlaps B |
100 |
1000 |
50 |
1050 |
0.158 |
0.0476 |
0.0909 |
0.5 |
A within B |
100 |
1000 |
100 |
1000 |
0.316 |
0.1 |
0.182 |
1 |
CTCF: Demonstration
70-95% of CTCF binding sites are also bound by cohesin complex (including SMC1, SMC3, RAD21, STAG1, and STAG2) to establish chromatin loops and regulate gene expression [1], [2].
We used CTCF-cohesin as a positive control to evaluate the performance of the six collocation measurements (including C, J, SD, SS, PMI and NPMI). We first calculated the scores of these metrics between all the binding sites (defined as cistrome) of CTCF with those cistromes of 1207 TFs curated in the ReMap database. Then, we calculate the Zscore as an overall measurement of the cobindability. Please note, TRIM22 is not part of the cohesin complex, but multiple studies have identified TRIM22 as a critical regulator of chromatin structure. TRIM22 bindings are highly enriched at chromatin contact domain boundaries [3], [4].
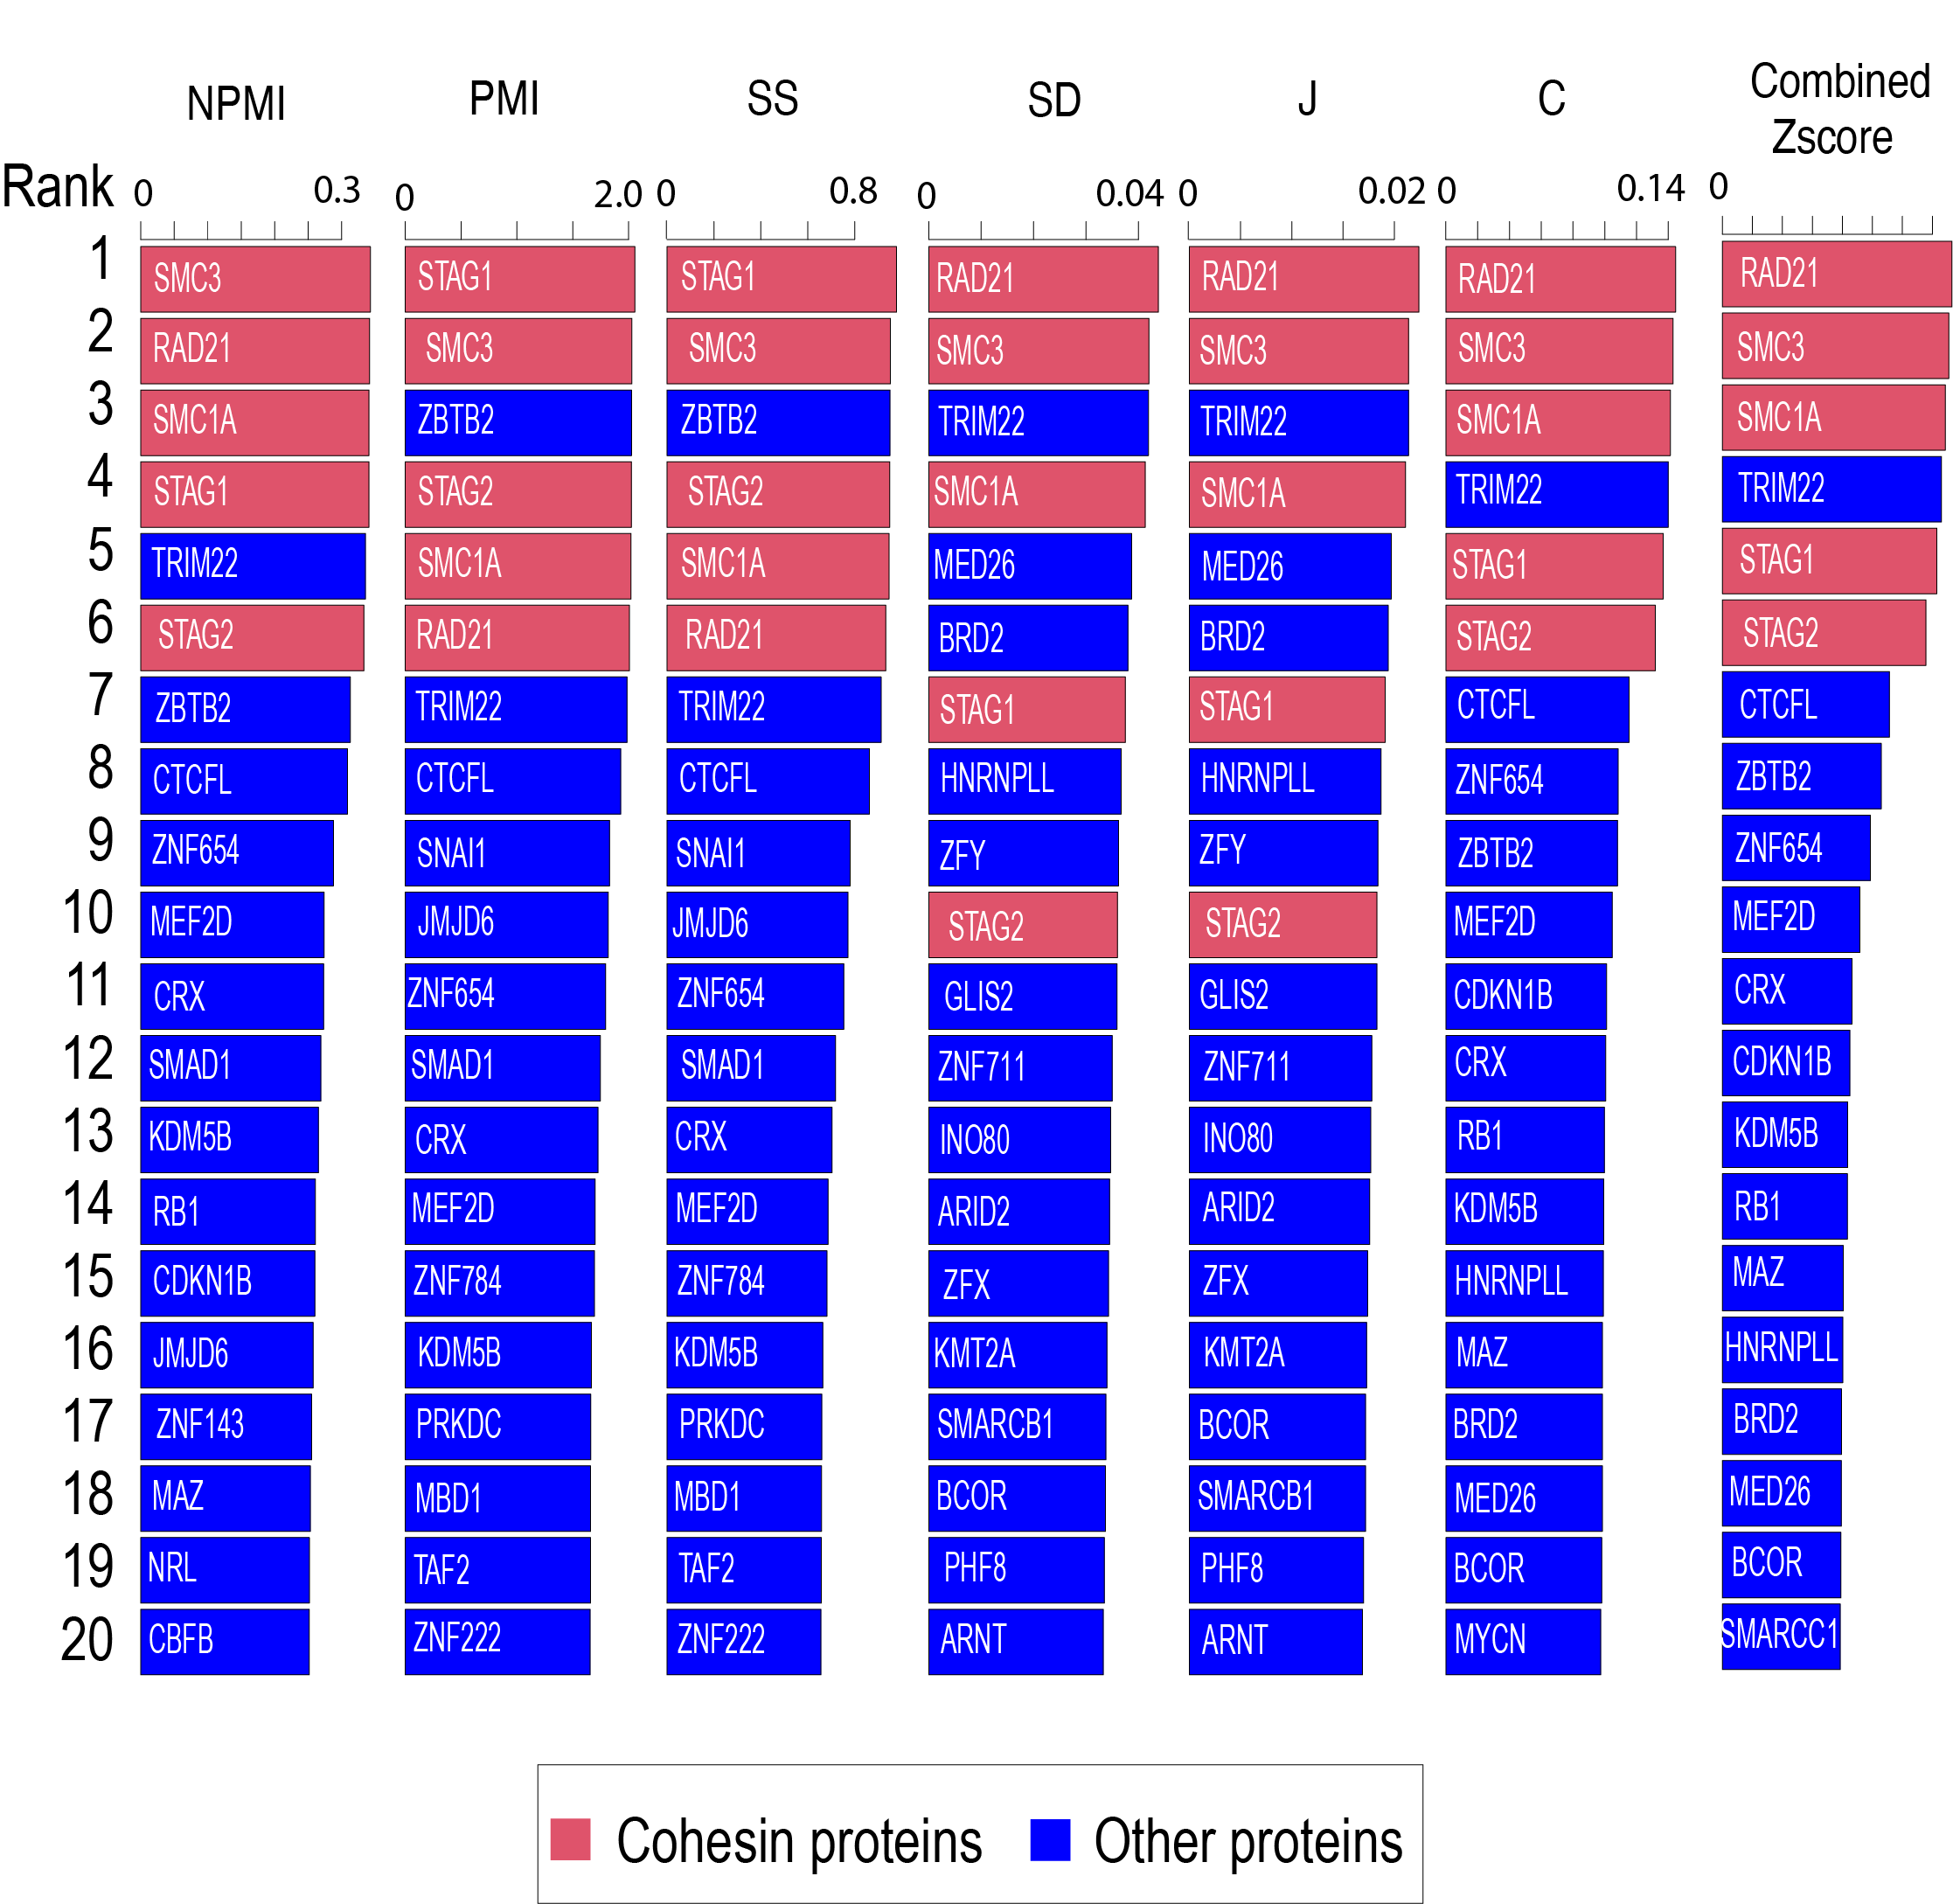
Collocation between CTCF binding sites and the binding sites of 1207 TFs were evaluated uing the six measurements as well as the zscore. Only the top 20 TFs were displayed.